PVGIS24 Calculator

PVGIS24 SOLAR PANEL CALCULATOR

PVGIS24: A solar calculation tool built on recognized expertise and a solid scientific foundation.

PVGIS24 represents a modern evolution and complement to PVGIS 5.3, which remains a key reference for design offices and specialized engineers. Developed using the latest scientific advancements from the European Research Center, PVGIS 5.3 has been essential in high-precision solar modeling and simulation. Its approach, aimed at a knowledgeable audience, laid the groundwork for a reliable and recognized tool in the solar energy field.
To meet the specific needs of installers, solar craftsmen, and individuals, while expanding access to this valuable data, PVGIS24 has been designed with a more intuitive interface and a simplified user experience, all while maintaining scientific rigor and result accuracy.
PVGIS 5.2
PVGIS24

PVGIS24: An Evolution in Solar Panel Calculation Adapted to Field Needs

  • 1 • Cutting-Edge Technology for More Efficient Solar Simulation

    PVGIS24 uses the latest advancements in solar modeling to provide analyses that accurately reflect real-world conditions.
    Its intuitive interface makes accessing data simple, enabling you to make quick and effective decisions.
  • 2 • Multi-Section Solar Simulations for Complex Projects

    You can simulate up to 4 different sections within a single solar project to analyze the impact of multiple orientations and tilts.
    This is ideal for multi-configuration solar installations, whether on roofs or on the ground.
  • 3 • Advanced Google Maps Integration for Better Geographical Accuracy

    PVGIS24 integrates Google Maps to provide solar simulations based on real-time cartographic data.
    This feature allows for enhanced visualization of the solar project, making it easier to identify shadow areas and optimize solar performance.
  • 4 • An Accessible and Multilingual Solar Tool

    Free and open to everyone, PVGIS24 democratizes access to accurate solar simulations.
    It also generates detailed professional solar reports that can be shared in multiple languages.

Evolving Technical Features of PVGIS24

Precise Modeling via GPS Geolocation

Precise Modeling via GPS Geolocation

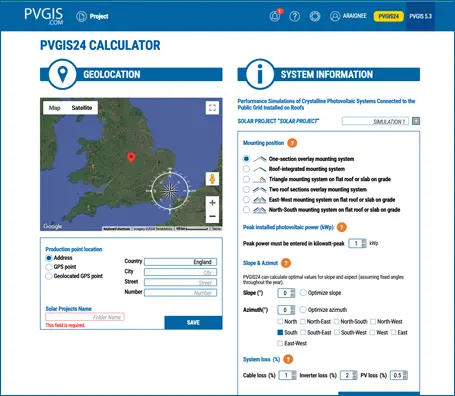
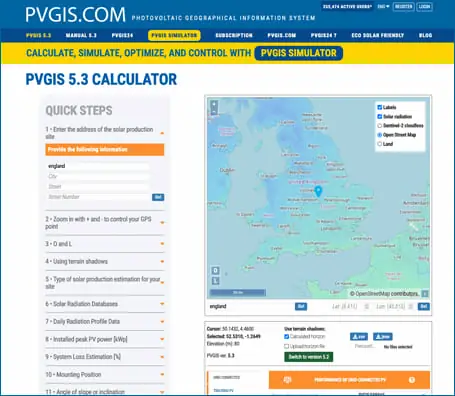
Using advanced Google Map geolocation, PVGIS24accurately identifies the GPS point of the installation. This approach enhances the accuracy of unlimited solar yield simulations by considering site-specific conditions such as altitude, shading, and solar angle.

Multi-Orientation and Multi-Inclination Simulation

PVGIS24has extended its simulation capabilities, now allowing yield calculations for systems with up to three or four sections, each with different orientations and tilts. This advanced feature accounts for every possible angle and orientation, making simulations even more precise for complex configurations.

With PVGIS24, users can simulate installations with two, three, or even four distinct tilts and orientationson a single site, a solution particularly suited for flat roofs and East-West or North-South triangle installations. This optimized calculation enables optimal solar irradiation capture, thereby maximizing the energy production potential of each panel.

Precise Modeling via GPS Geolocation

Accuracy and Reliability of PVGIS24 Data

PVGIS24 is based on an integrated meteorological climate database, constantly updated. This allows for the simulation of solar energy production using actual sunlight data for every location worldwide.

4 solar radiation databases with accurate hourly measurements Automatic selection of the most relevant database based on your geographical area Result: unlimited simulation of solar yield with unmatched reliability

A Neutral, Recognized, and Global Tool

PVGIS24 is based on algorithms from the European Commission (JRC), used for over 20 years by:
engineers,
solar craftsmen,
investors,
and public institutions.

PVGIS24 works in every country in the world. It offers you a neutral analysis, free or subscription-based depending on features, without commercial influence.

Precise Modeling via GPS Geolocation

Photovoltaic Energy Production Hours with PVGIS24

A key indicator for assessing the profitability of a solar project
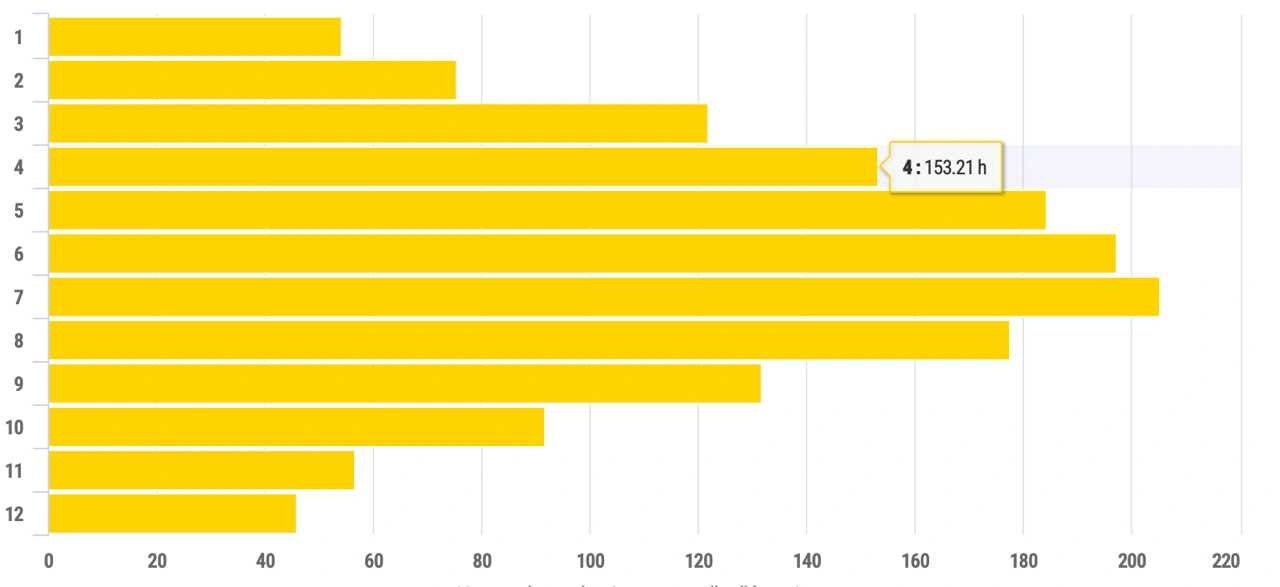
Photovoltaic energy production hours refer to the number of hours during which a system produces the equivalent of its rated power (expressed in kWh/kWp). It is not a continuous duration of sunlight but rather an average equivalent production spread over the year.
  • For example, a 1 kWp system producing 1,438 kWh/year is equivalent to 1,438 hours of production at full power.
  • These hours help estimate revenue, energy savings, and most importantly, return on investment (ROI).
The higher the production hours, the more profitable the installation.
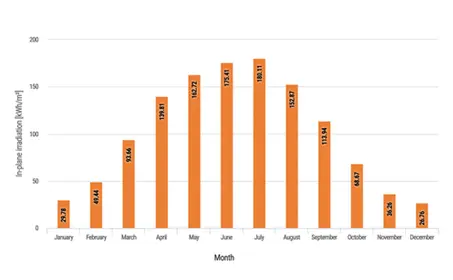
A monthly projection to optimize energy use
The month-by-month breakdown allows you to:
  • Plan for production peaks and thus adjust usage (for example, to heat water or charge a solar-powered car in December rather than June in some regions).
  • Adjust storage size (batteries) according to the weaker months.
  • Anticipate seasonal decline and maintain energy comfort.

Using Terrain Shadows

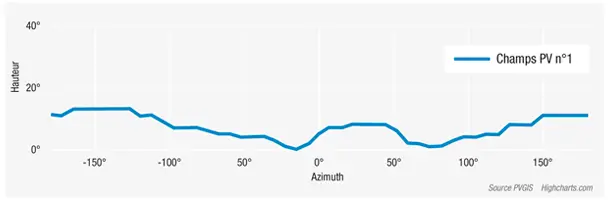
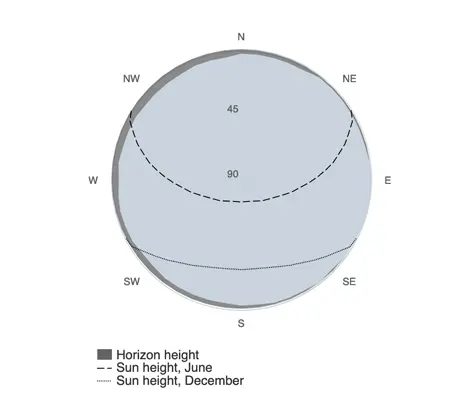
Geographic Site Shadows: PVGIS24automatically integrates shadows caused by nearby hills or mountains that may block sunlight during certain hours. This calculation excludes shadows from nearby objects such as houses or trees, providing a more relevant representation of local conditions.

Precise Modeling via GPS Geolocation

Modular Approach for Complex Projects

PVGIS24allows for unlimited adjustments of solar yield simulation parameters according to project specifications, such as panel inclination, multiple orientations, or differentiated yield scenarios. This offers unmatched flexibility for engineers and designers.

PV Technology

Over the last two decades, many photovoltaic technologies have become less prominent. PVGIS24 prioritizes crystalline silicon panels by default, which are predominantly used in residential and commercial rooftop installations.

Simulation Output

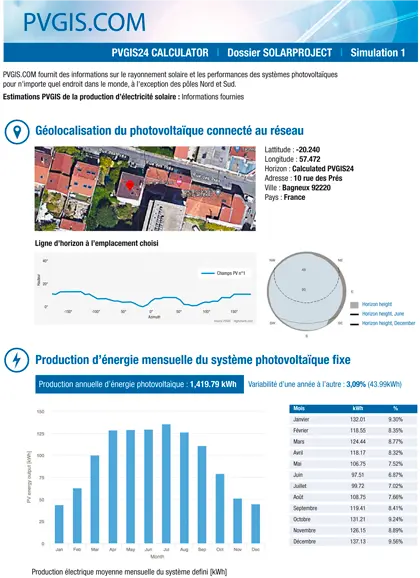
PVGIS24enhances results visualization by instantly displaying monthly production in kWh as bar charts and percentages in a summary table, making data interpretation more intuitive.

CSV, JSON Export

Some data options deemed less relevant for unlimited solar yield simulations have been removed in PVGIS24to simplify the user experience.

Visualization and Technical Data Reporting

Results are presented as detailed technical graphs and tables, facilitating the analysis of photovoltaic system performance. The data can be used for ROI calculations, financial analyses, and scenario comparisons.
Precise Modeling via GPS Geolocation