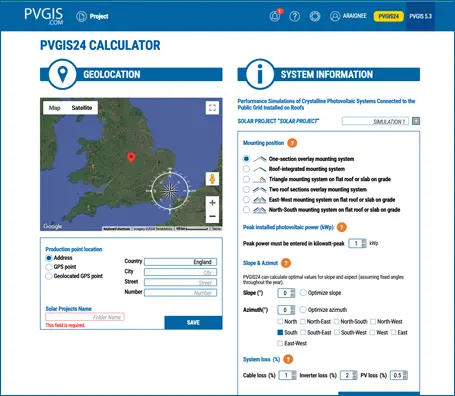
Modular Approach for Complex Projects
PVGIS24allows for unlimited adjustments of solar yield
simulation parameters according to project specifications,
such as panel inclination,
multiple orientations,
or differentiated yield scenarios. This offers unmatched flexibility for engineers and
designers.
PV Technology
Over the last two decades,
many photovoltaic technologies have become less prominent. PVGIS24 prioritizes crystalline
silicon panels by default,
which are predominantly used in residential and commercial rooftop installations.
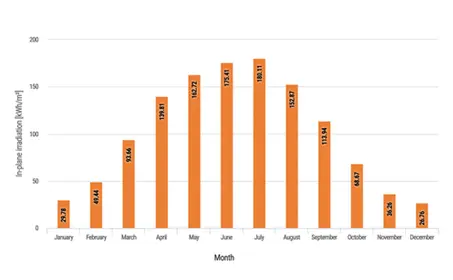
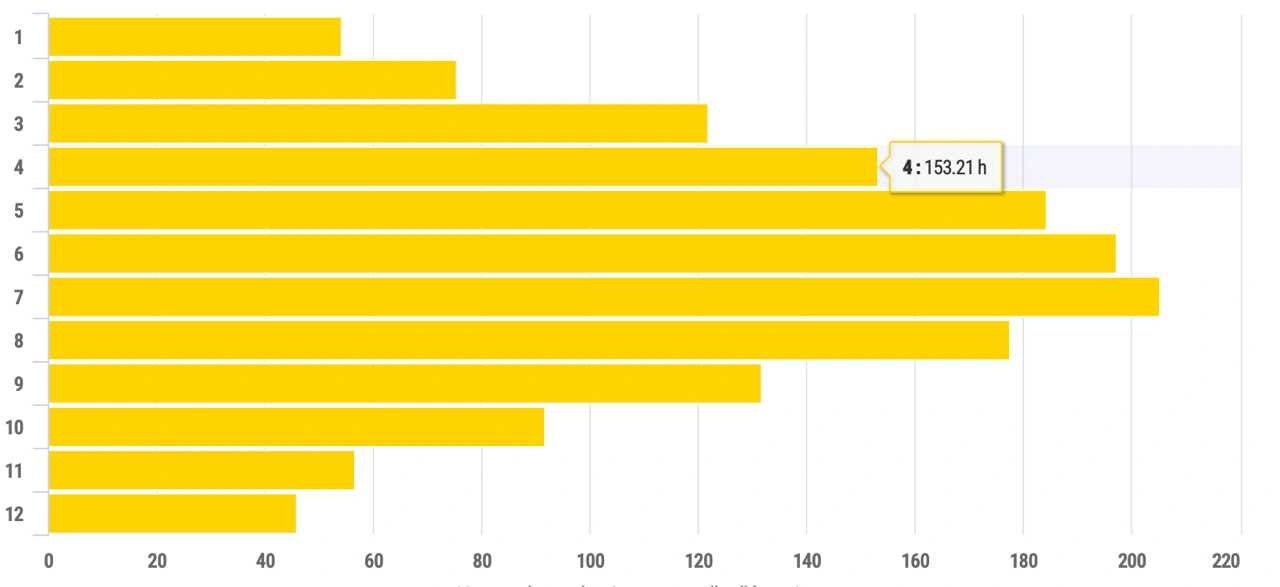
Simulation Output
PVGIS24enhances results
visualization by instantly displaying monthly production in kWh as bar charts and percentages in
a summary table,
making data interpretation more intuitive.
CSV,
JSON Export
Some data options deemed less relevant for unlimited solar yield simulations have been removed in
PVGIS24to simplify the user experience.
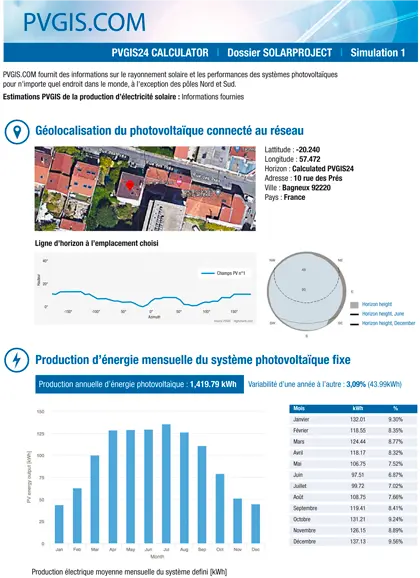
Visualization and Technical Data Reporting
Results are presented as detailed technical graphs and tables,
facilitating the analysis of photovoltaic system performance. The data can be used for ROI
calculations,
financial analyses,
and scenario comparisons.