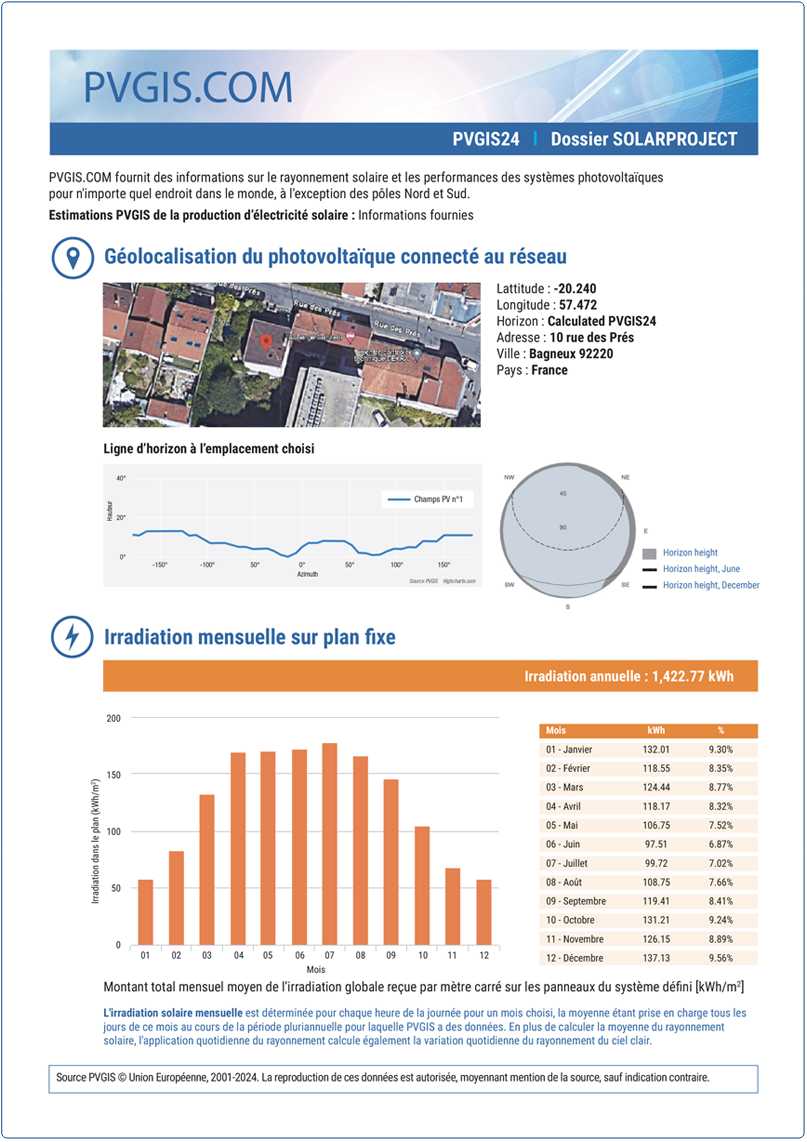
PVGIS.COM provides information on solarradiation and photovoltaicsystem performance for any location in the world, exceptforthe North and South Poles.
PVGIS estimatesof solar electricity production: Information provided
Monthly solar irradiation isdetermined for each hourofthe day for a chosen month, the average being taken every daysofthismonth during the
multi-year period forwhich PVGIShasdata. In addition to averaging the radiation solar, the daily radiation application also calculates the daily
variation ofclear sky radiation.
PHOTOVOLTAIC GEOGRAPHICAL INFORMATION SYSTEM
{{user_count}} active users*
8,289 SIMULATIONS RÉALISÉES HIER
PHOTOVOLTAIC GEOGRAPHICAL INFORMATION SYSTEM
Confirm profile information
Please Confirm some Profile Information before proceeding
Are you sure you want to disconnect?
Terms and Conditions
A validation email has just been sent to you at :
Please click on the link to confirm your registration.
PVGIS24 Solar Production PDF Simulations
The simulations offered on PVGIS.COM are designed to satisfy the varied requirements of professionals as well as individuals in the solar-energy sector. This service is supported by a consortium of European solar experts and engineers, ensuring independent and neutral expertise. Here are the main stakeholders and objectives covered by the simulations.
The PDF example below is in English.
Your own report will be automatically generated
in the language you selected in your account settings.
PVGIS24 yield simulation
Download the PDF sample
The result of the photovoltaicenergy calculation is the average monthly energy production and the
average annual production ofthe
photovoltaicinstallationwith the chosen properties. Inter-annual variability is the standard
deviation ofthe annual values calculated on
the period covered by the selected solarradiation database.
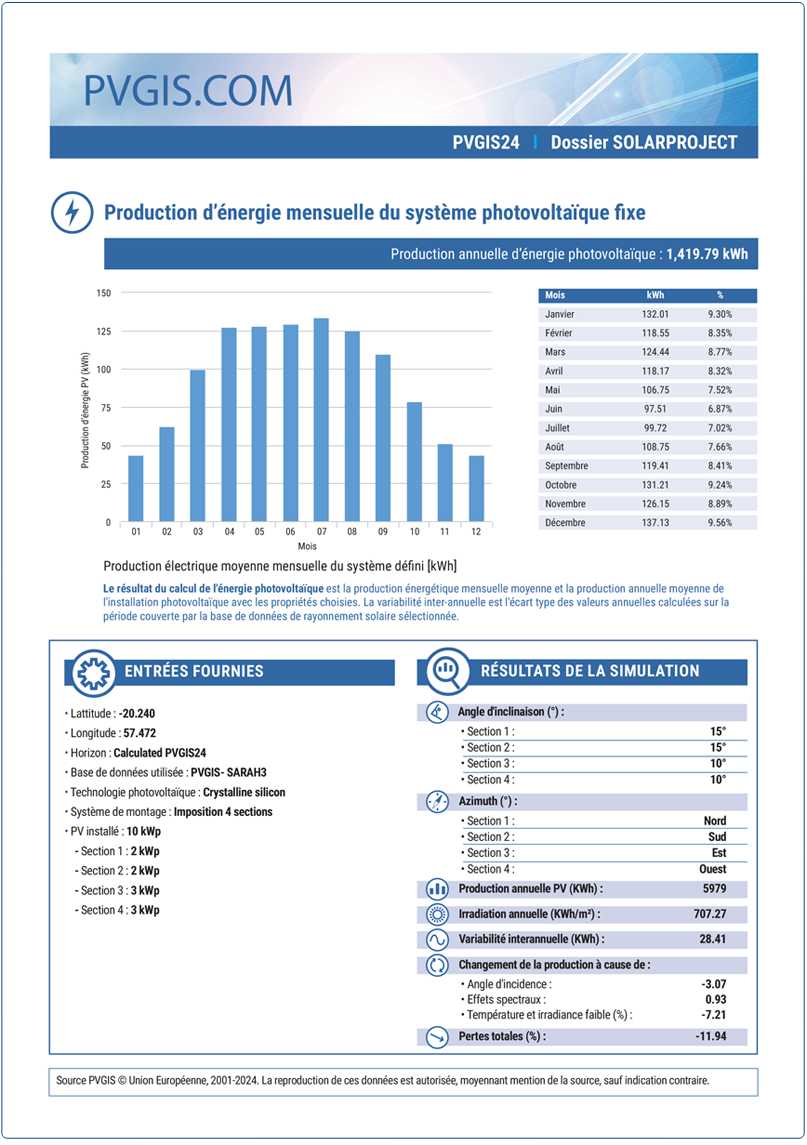
Each green bar represents the average amountof electricity (kWh) generated each month by the fixed
photovoltaicsystem. The sum
ofthese values corresponds to the total annual production shown atthe top ofthe chart. Thisgraph
helpsevaluate the seasonal
distribution ofsolar production, an essentialfactorfor estimating self-consumption and project
profitability
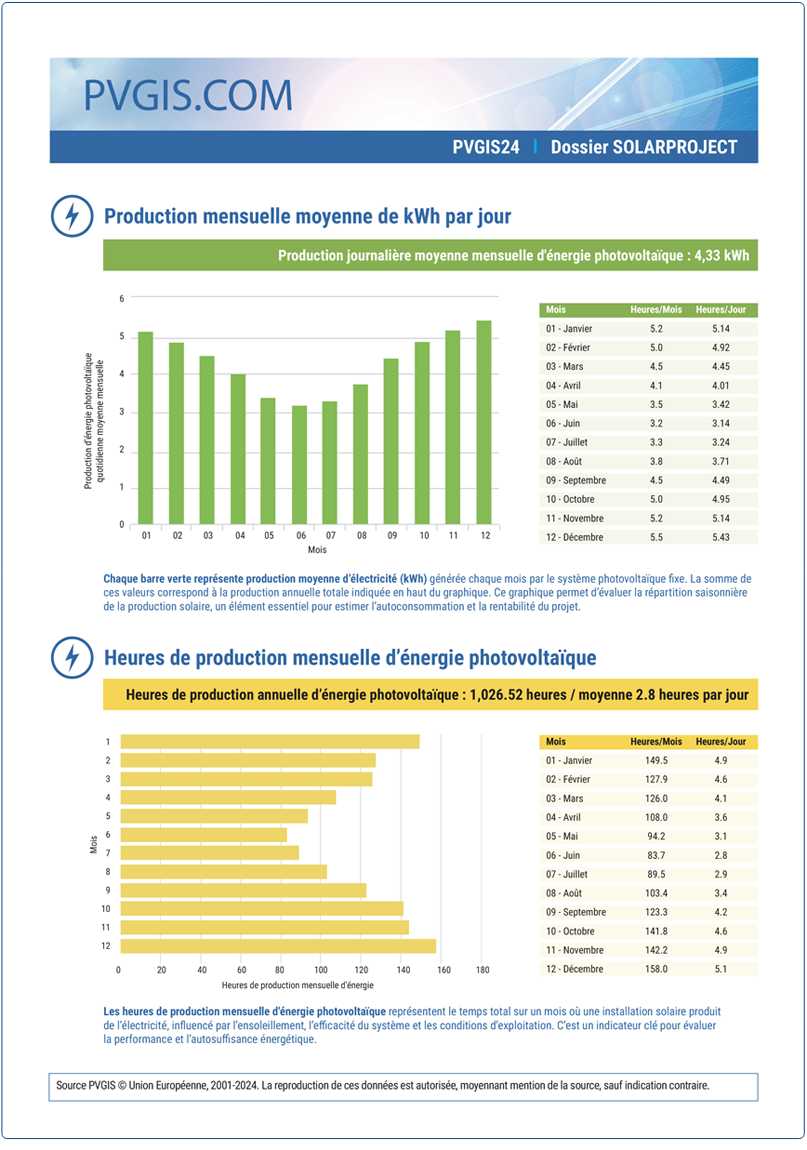
Monthly photovoltaic energy production hours represent the total time over a month that a solar installation produces electricity, influenced by sunlight, system efficiency and operating conditions. It is a key indicator to evaluate performance and energy self-sufficiency.
Monthly photovoltaic energy production hours represent the total time over a month that a solar installation produces electricity, influenced by sunlight, system efficiency and operating conditions. It is a key indicator to evaluate performance and energy self-sufficiency.
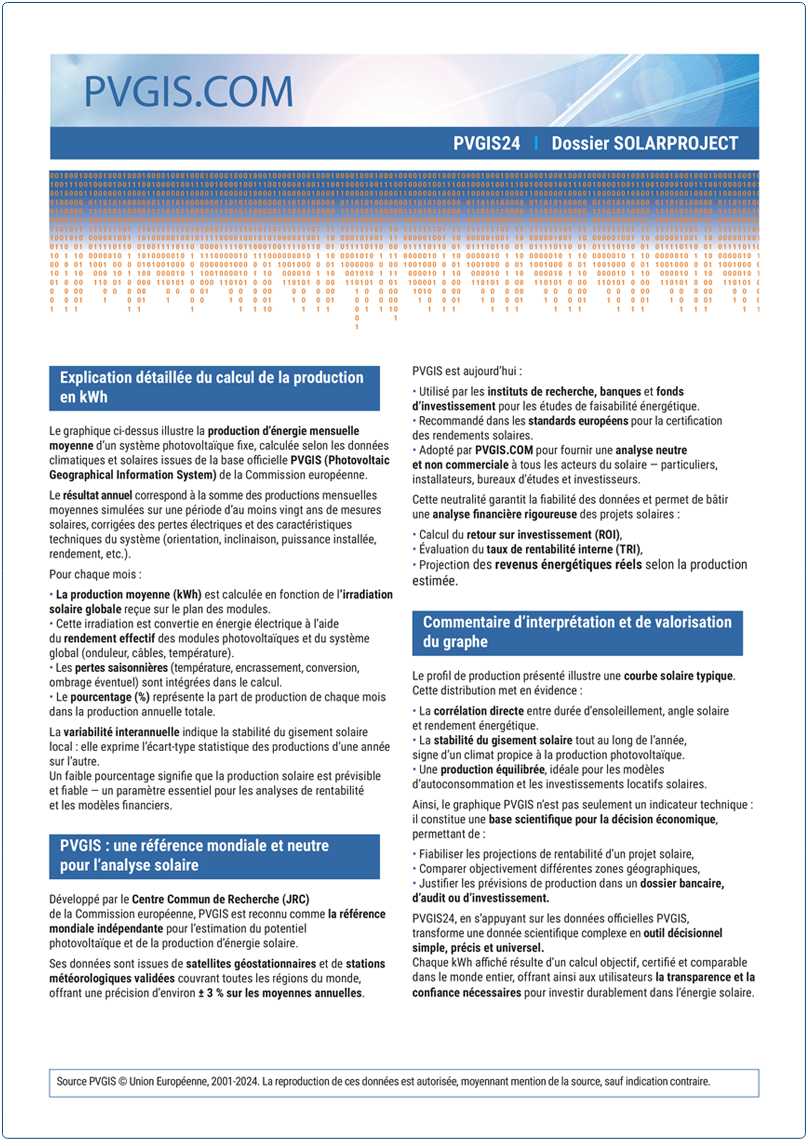
Detailed explanation of the production calculation in kWh
PVGIS: a global and neutral reference for solar analysis
Interpretation and valuation commentary of the graph
PVGIS Glossary for the Photovoltaic System Performance Simulator
Terrain shadows Solar Radiation Database PV Technology Monocrystalline or Polycrystalline Peak Power Output of Installed PV Estimation of System Losses Mounting Position Slope or Tilt Angle Azimuth or horizon
Terrain shadows Solar Radiation Database PV Technology Monocrystalline or Polycrystalline Peak Power Output of Installed PV Estimation of System Losses Mounting Position Slope or Tilt Angle Azimuth or horizon